Methods
How We Built the Dataset
Sources, procedures, and decisions behind the atlas
From archives to atlas
Building a consistent, municipality-level dataset for three elections held nearly a century ago required combining sources of very different kinds: printed provincial gazettes, archival records held at different archives, digitised copies of newspapers, appendices of doctoral dissertations, books written by local historians, and more.
This page provides some key information and documents methodological decisions that are necessary to understand the dataset and use it appropriately. It also includes a gallery of source examples. For a more detailed account of the codebook and operationalisation, see the Dataset tab.
Where the numbers come from
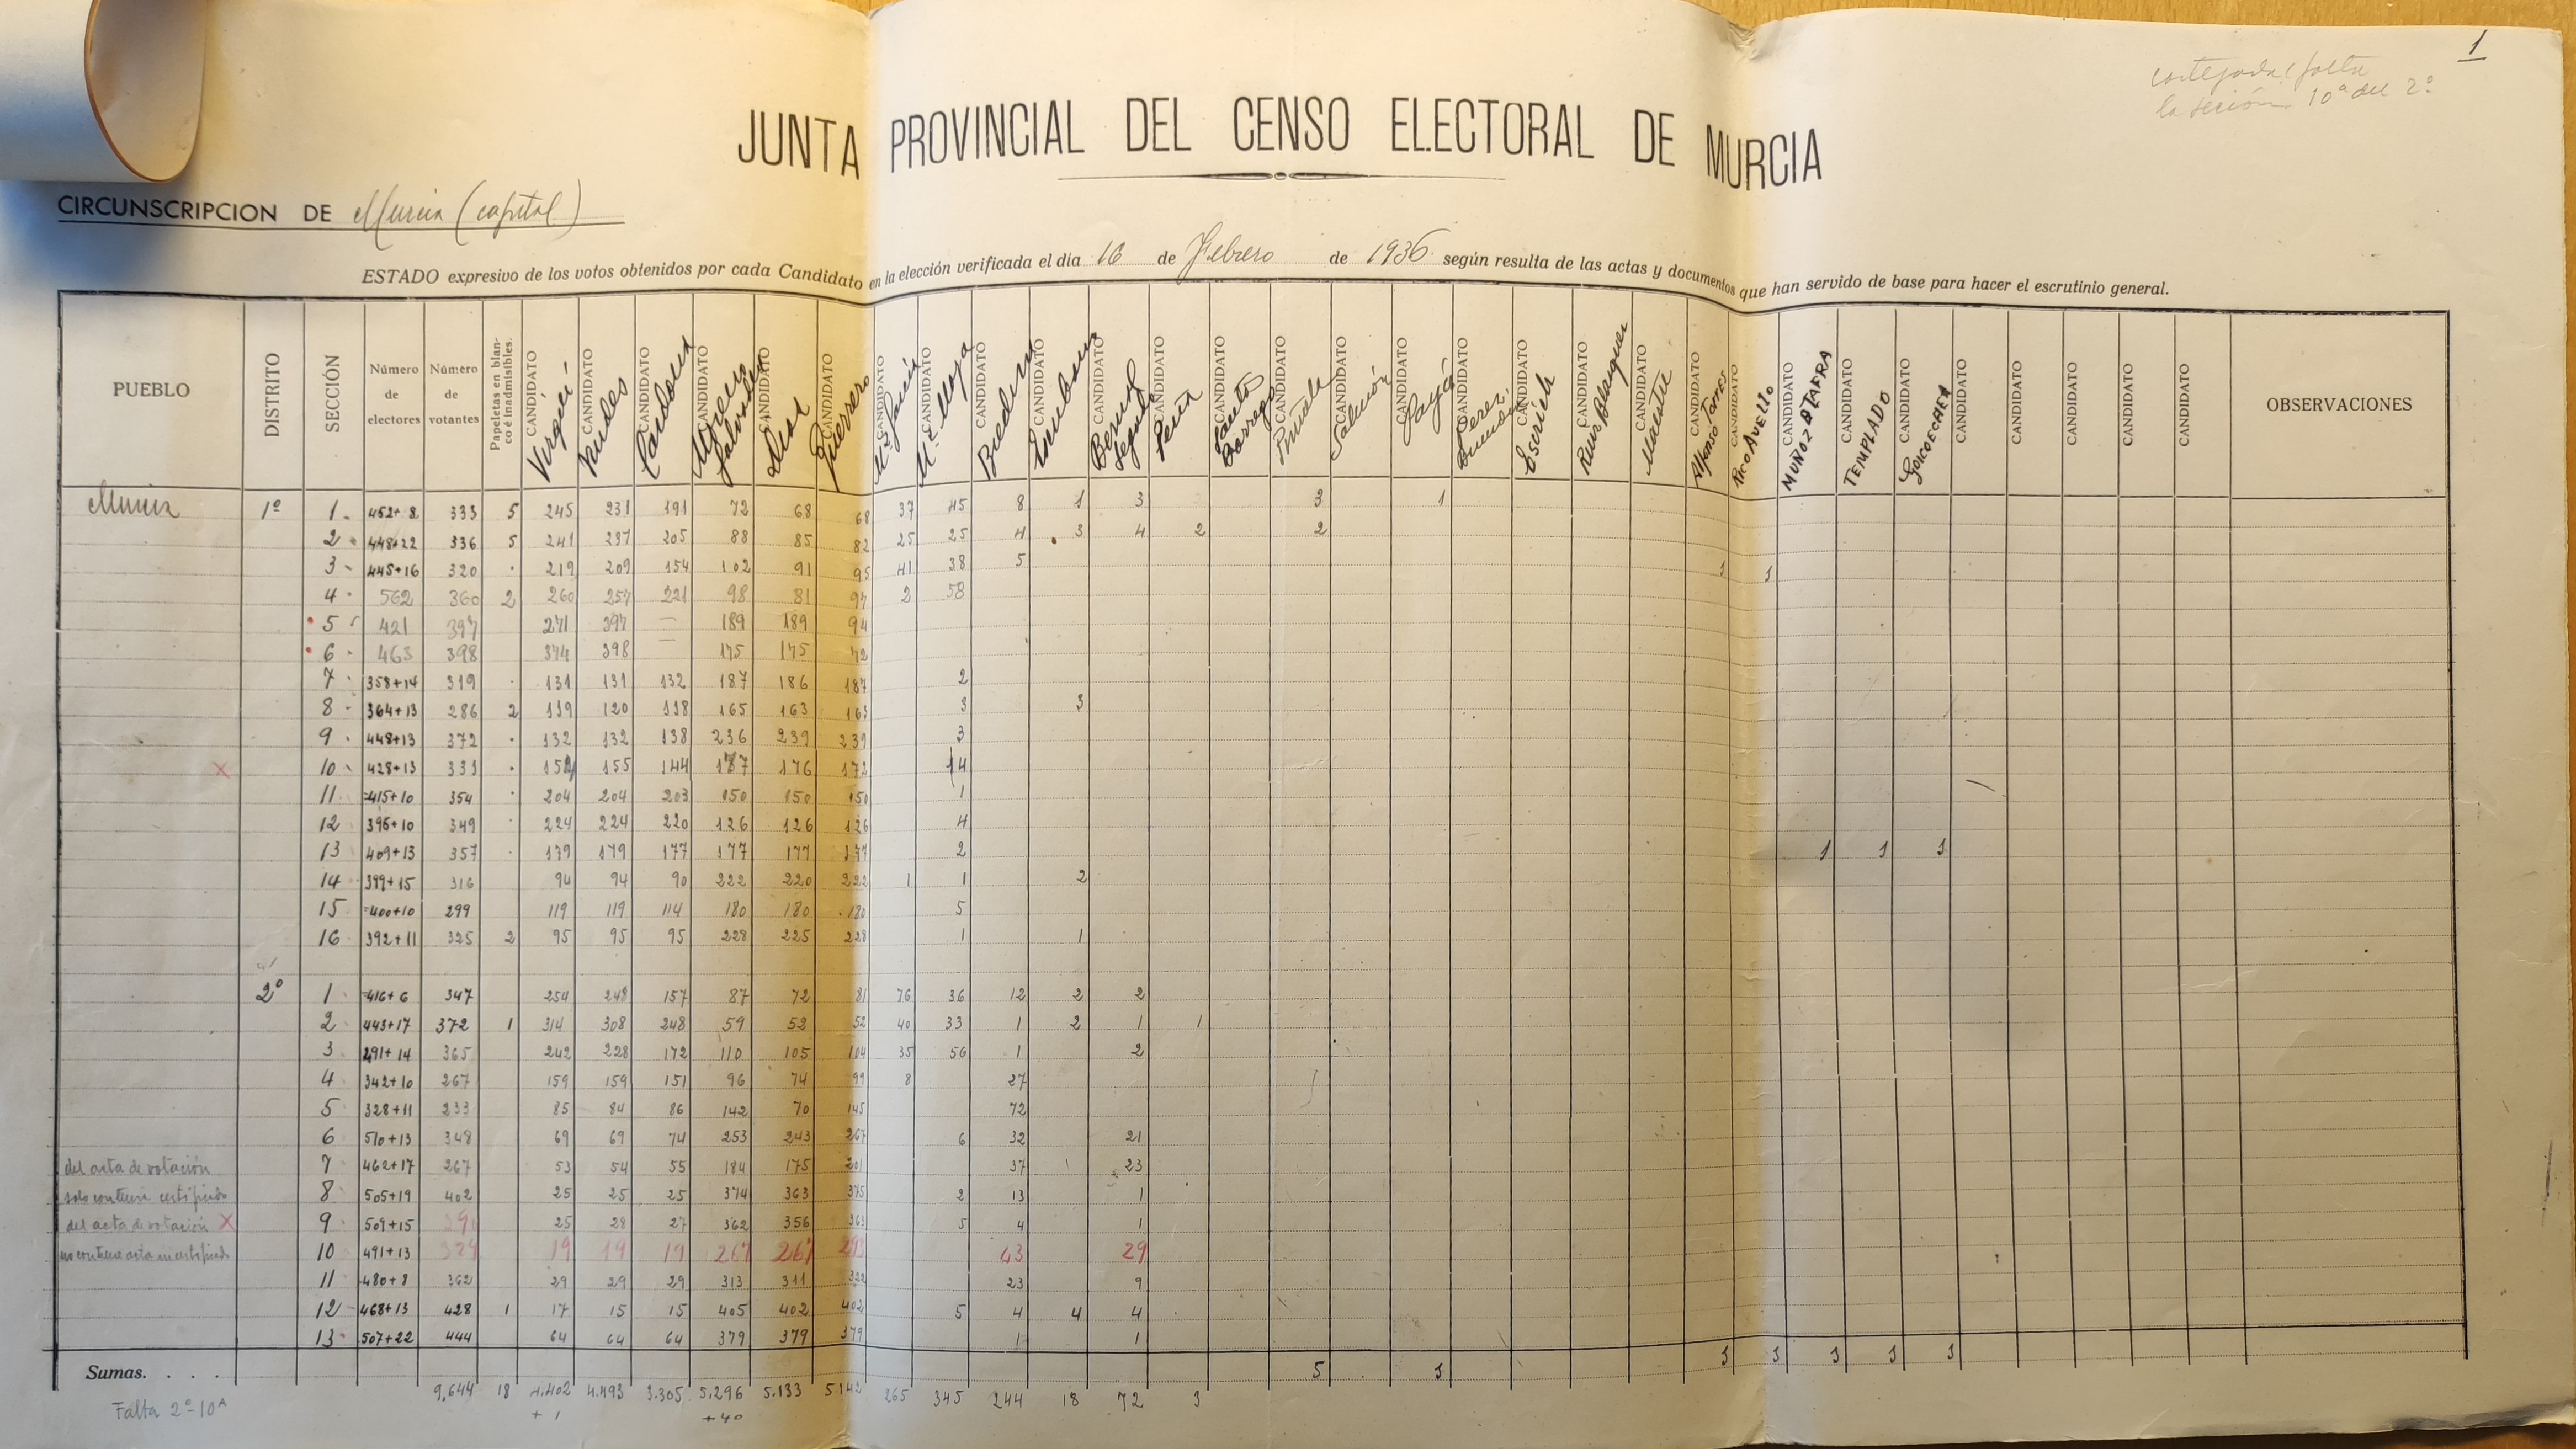
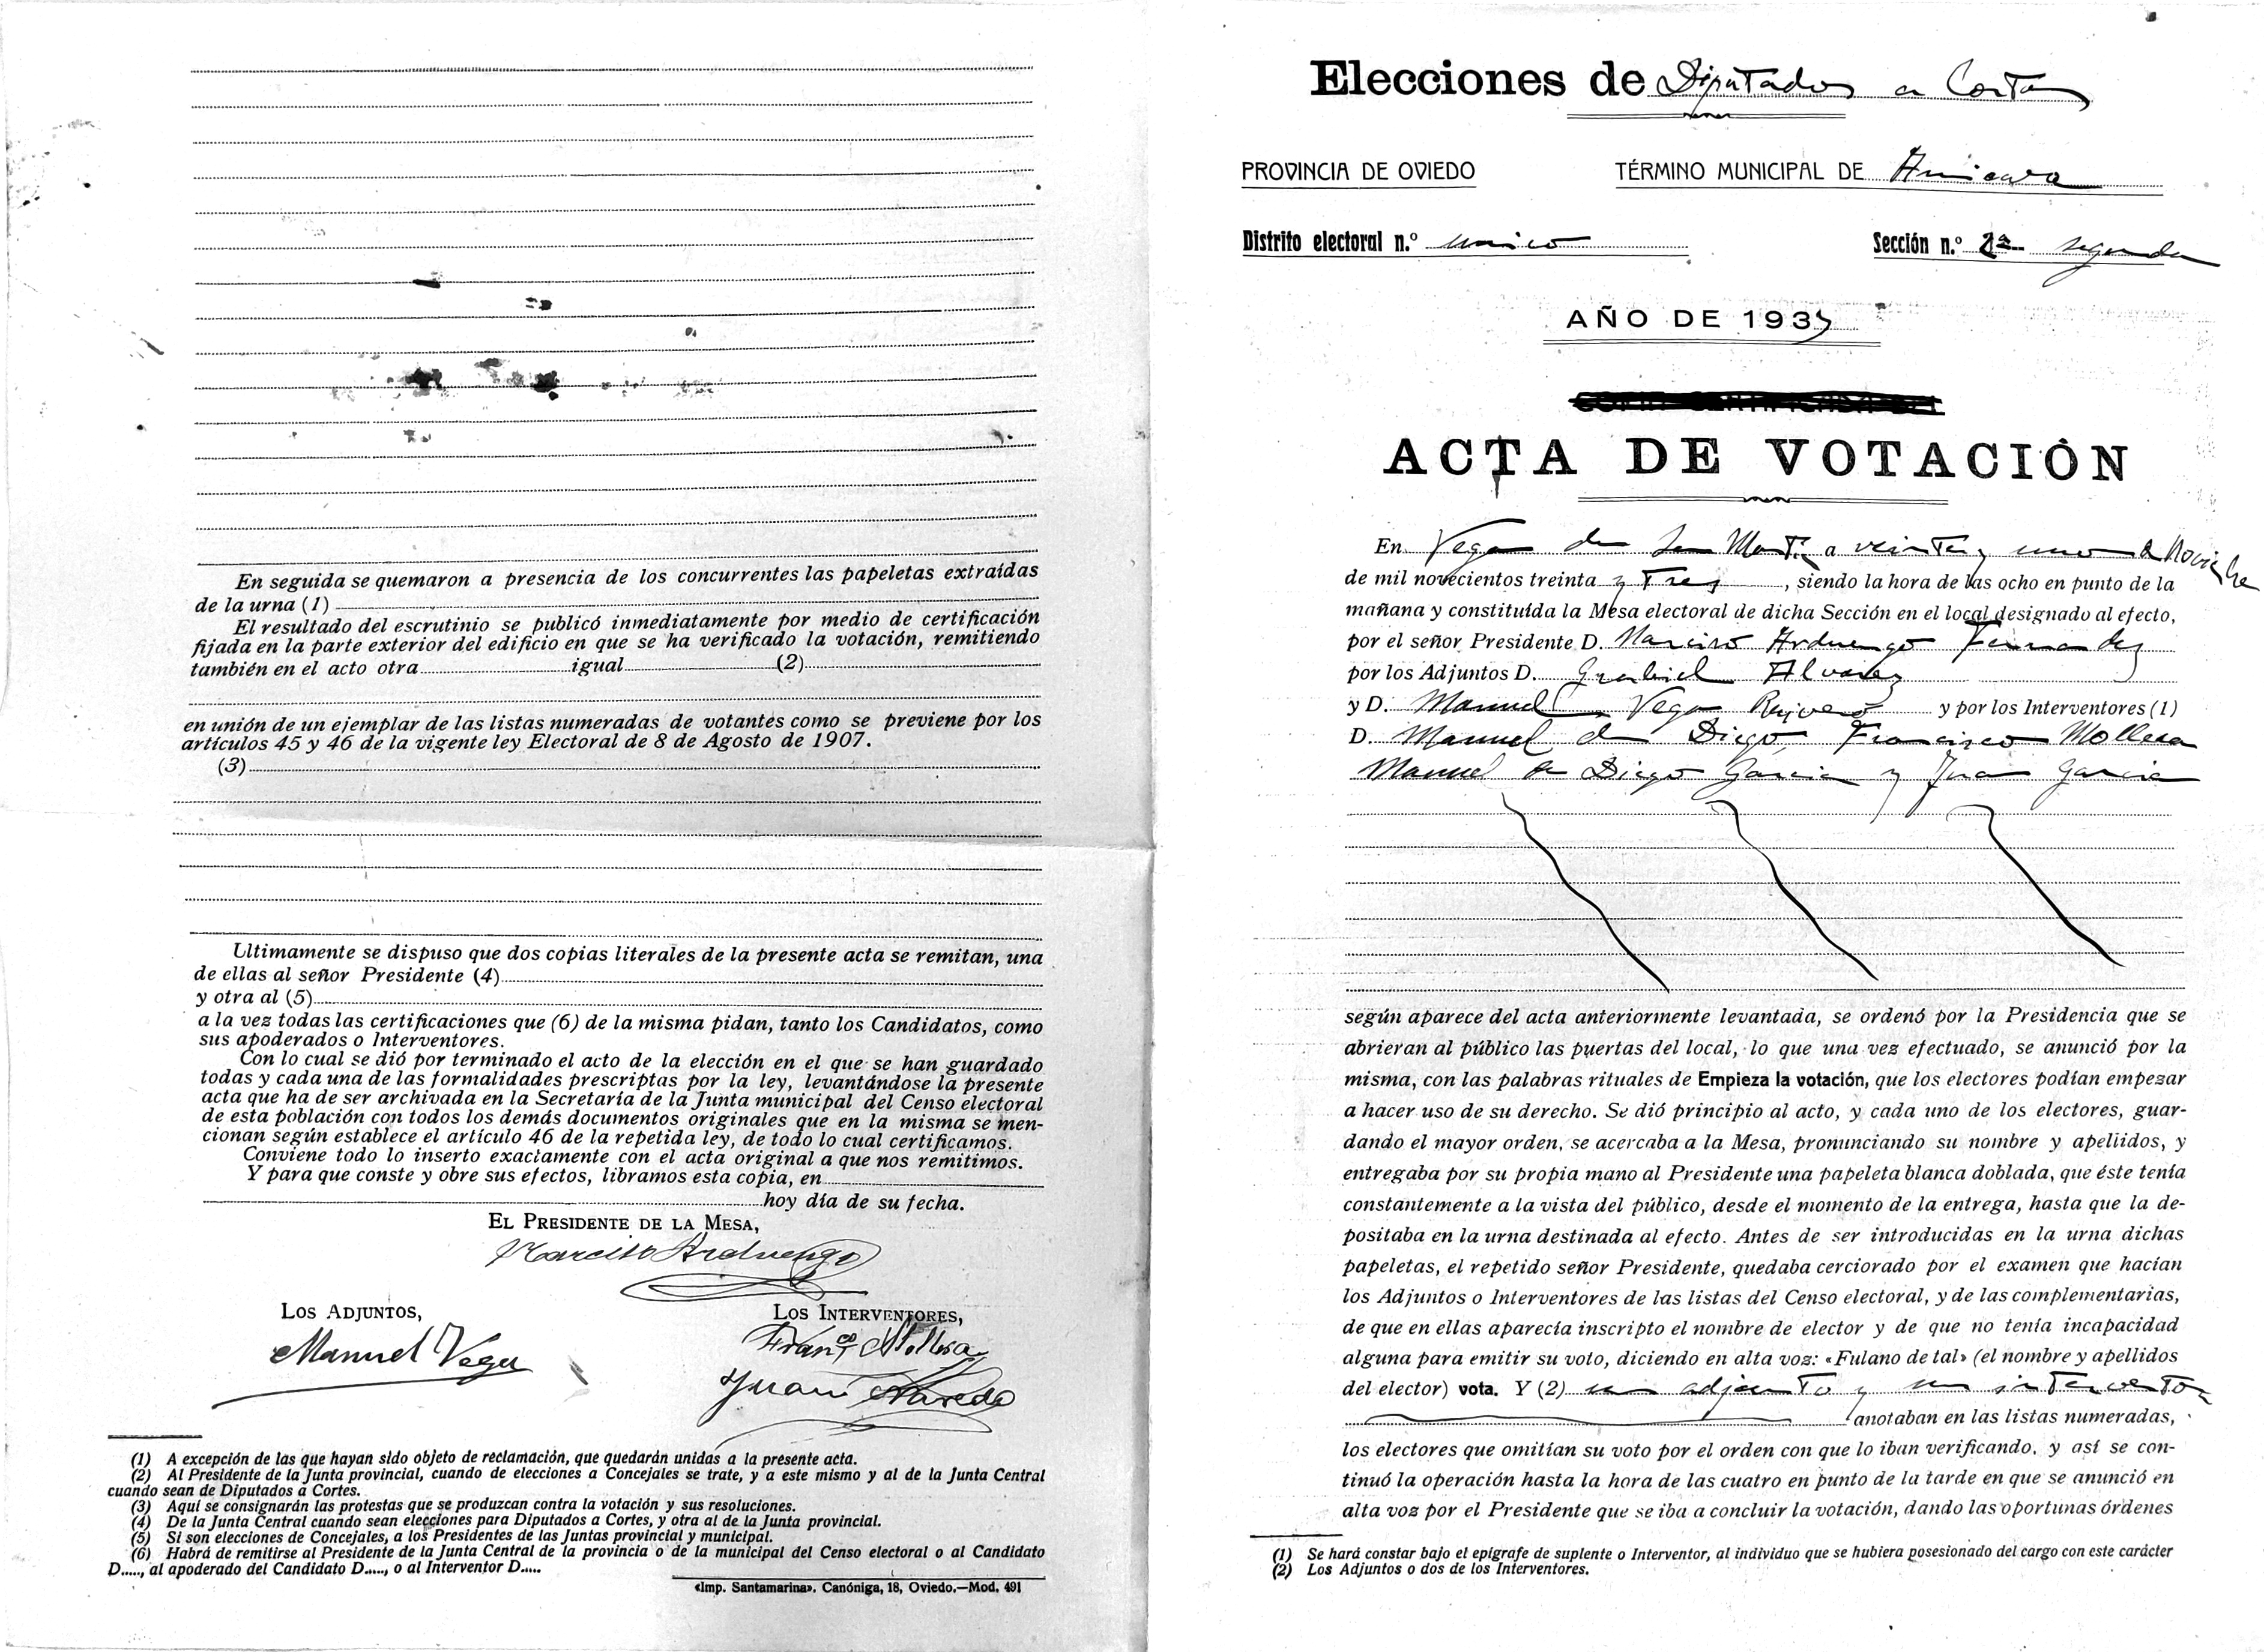
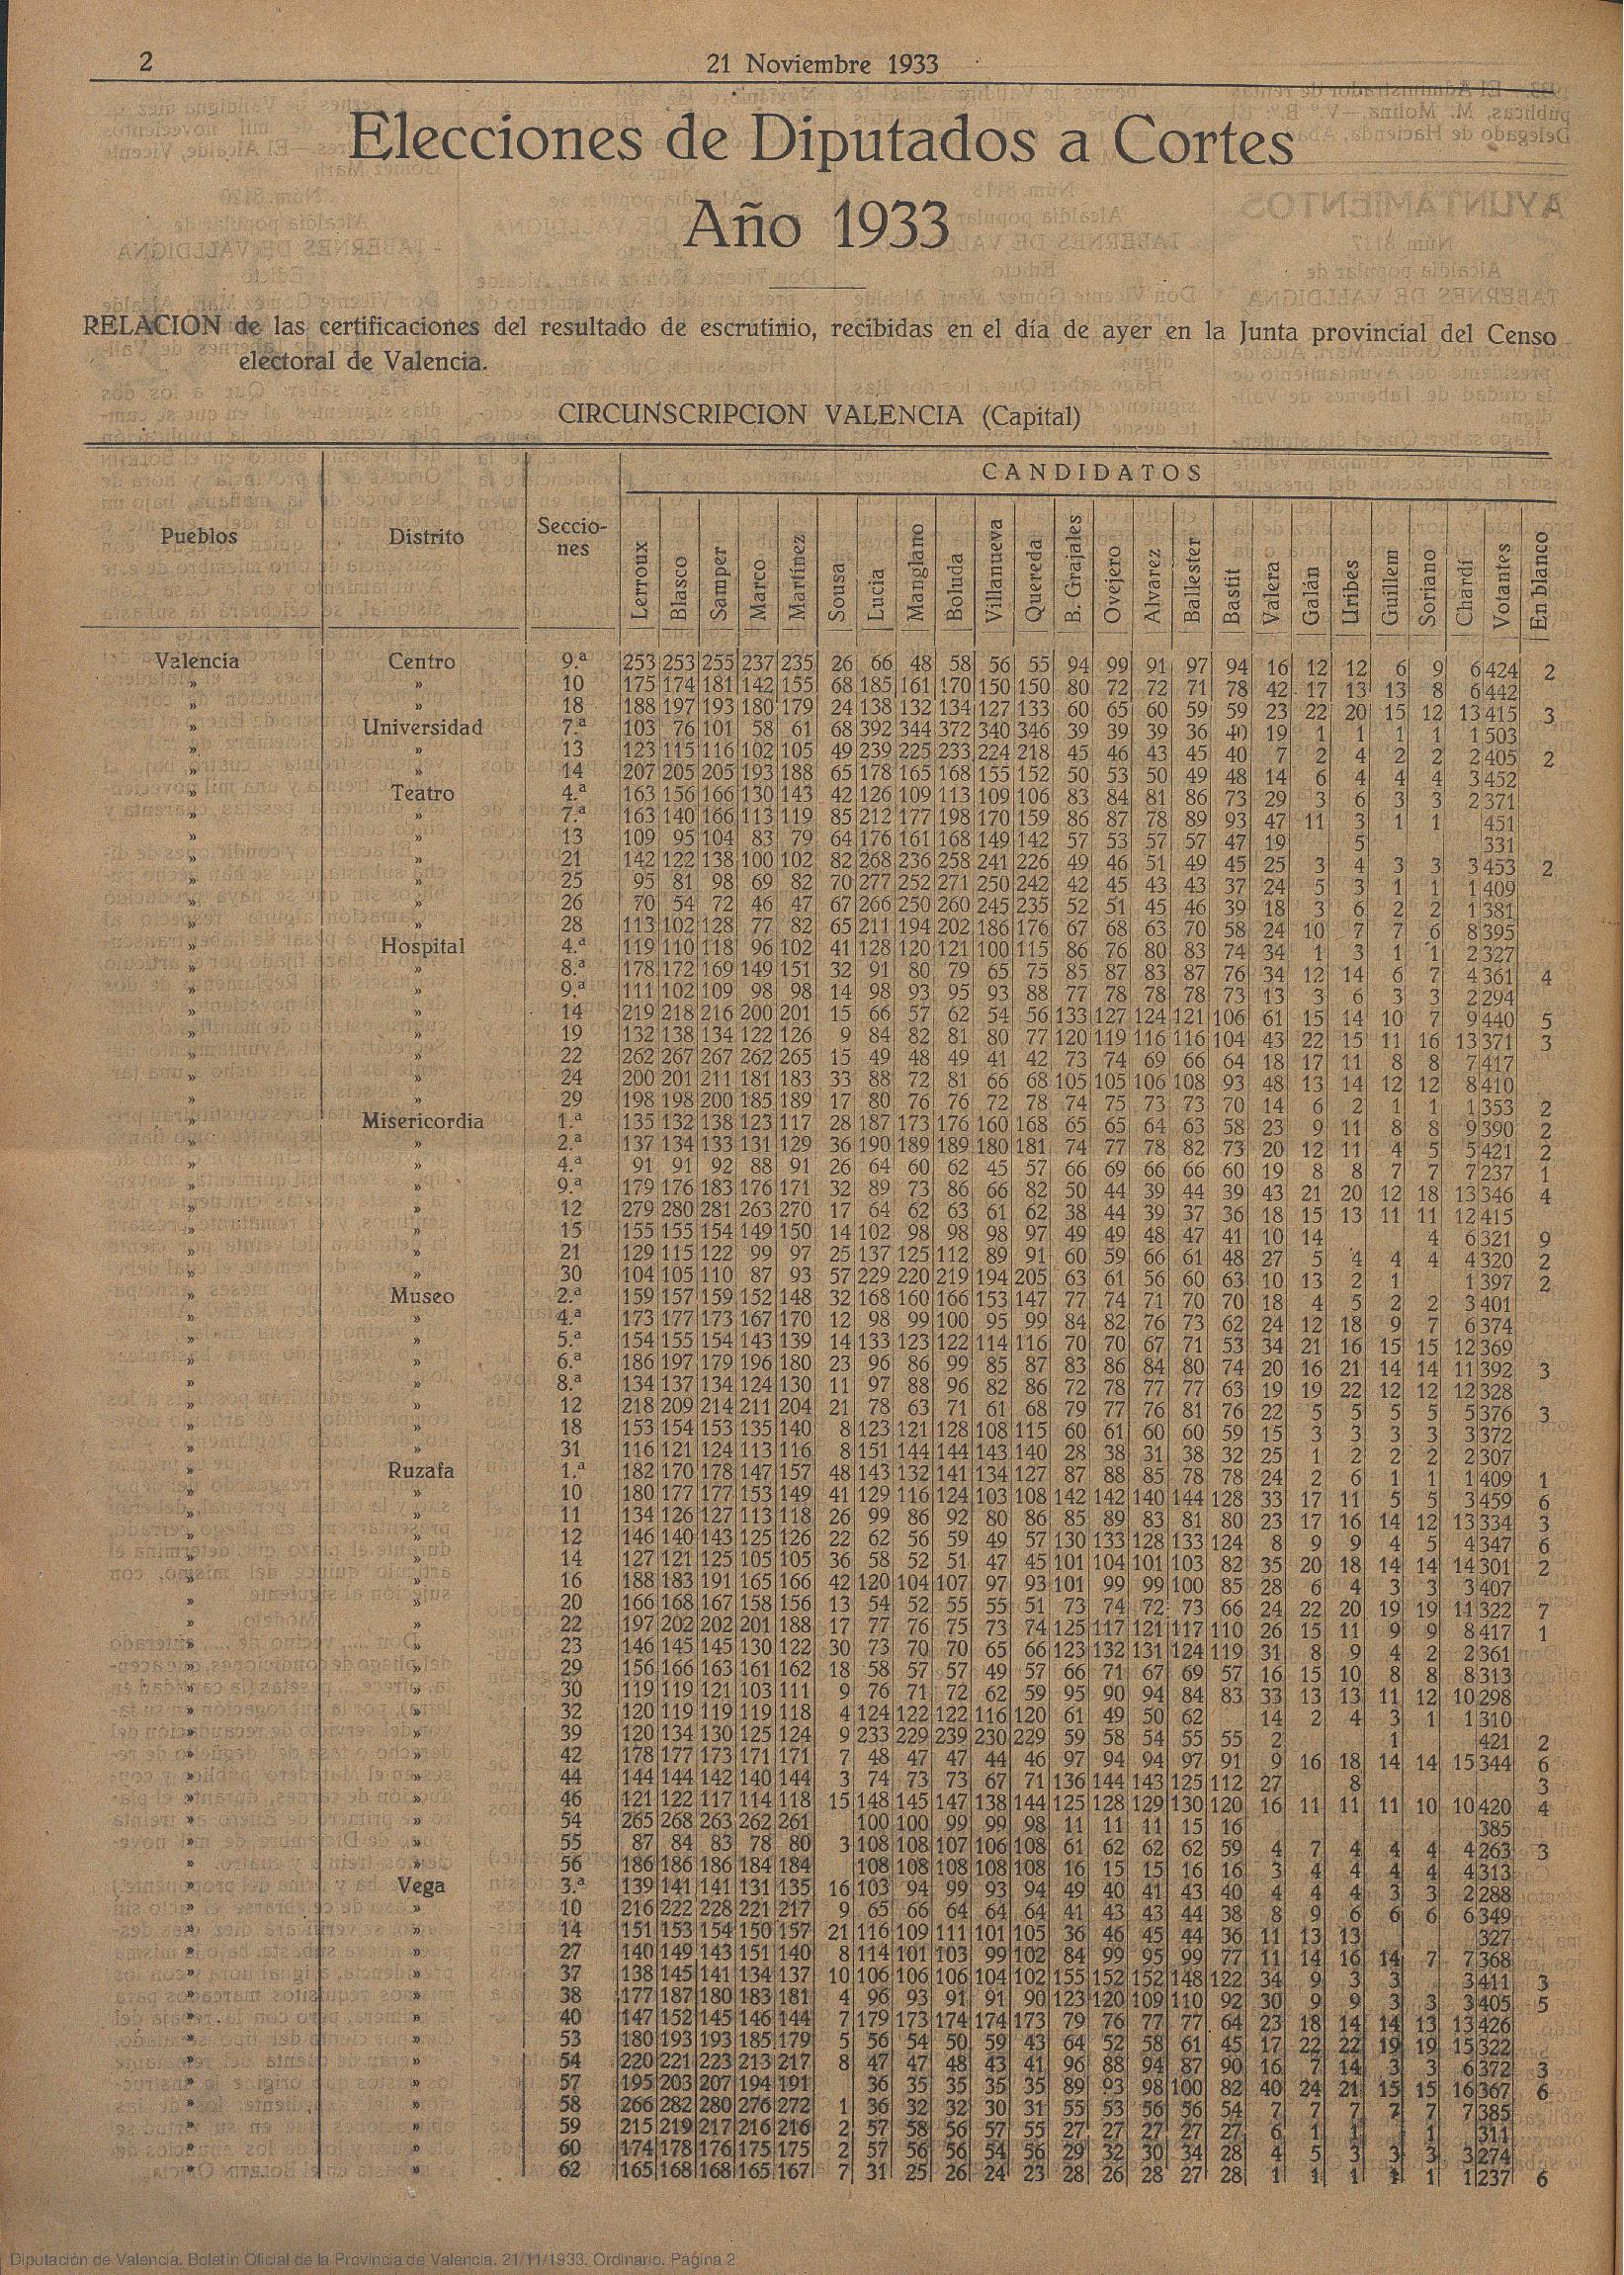
Election results were reported at the district (circunscripción) level in official publications, but municipal breakdowns were recorded in several records, local press, and in the handwritten ledgers deposited across the country. We combined all three to maximise geographic coverage. In some cases, historians and political scientists had already collected, fully or partially, some results and had digitised them or used them for parallel research. Thanks to everyone for the enormous effort. In the codebook, available in the Dataset tab, the sources used for each municipality and electoral year are detailed. In some cases, such as Catalonia, other political scientists had already undertaken the tremendous effort of digitising municipal results, which we were able to incorporate into our dataset (thanks, Pau!).
Municipal boundaries are derived from the 1930 Census cartography and have been harmonised to allow comparisons across election years, accounting for municipal mergers and splits that occurred during the Republic.
What the originals look like
Below are examples of the primary sources used in the data collection process.
Key choices and limitations
Party groupings were standardised as much as possible in all three elections using a consistent classification. The groupings are different over time, reflecting the changing political landscape of the Republic, but they are consistent across municipalities within each election year. The full classification and coding decisions are described in the Dataset tab. The codebook documents all the different decisions made during the coding process, including how we dealt with missing data, ambiguous cases, and other challenges that arose during data collection. We note that in some cases there was not a 'perfect' decision, and we had to make judgement calls based on the available information. We have documented these decisions in the codebook to ensure transparency and reproducibility.
The Map includes two turnout figures. The option 'Turnout' indicates the percentage of voters based on the number of actual voters (votant) and registered voters (elect), where available. As can be seen, the information on registered voters, actual voters or both was not available for all municipalities. The option 'Turnout estimated' aims to provide a more complete picture of electoral participation following our best efforts to estimate missing data. This variable was computed using the total number of votes cast (total_votes), the maximum number of candidates voters could include in their ballot in each electoral constituency (majority_seats), and estimated electors data (elect_est).
A full description of every variable, its source, and the decisions made during coding is available in the Dataset tab.